When it comes to energy production and consumption, Australia is nothing if not a contradiction.
On the one hand, Australia continues to lead the world with the highest rate of solar adoption championed by generous government incentives and a competitive local solar market. On the other hand, Australia is the world’s fourth largest exporter of black coal and continues to rely on fossil fuels for energy and economy.
In this article, we’ve collated some of the most interesting and illuminating energy statistics and insights from the Department of Climate Change, Energy, the Environment and Water (DCCEEW), Geoscience Australia and the Australian Bureau of Statistics (ABS); and broken them down into general, renewables categories.
Table of contents
General energy consumption statistics
Australia’s total energy consumption increased slightly in 2024 despite a 3.4% drop in household energy use. Highlighted below are some statistics on how Australia, as a whole, consumes energy.

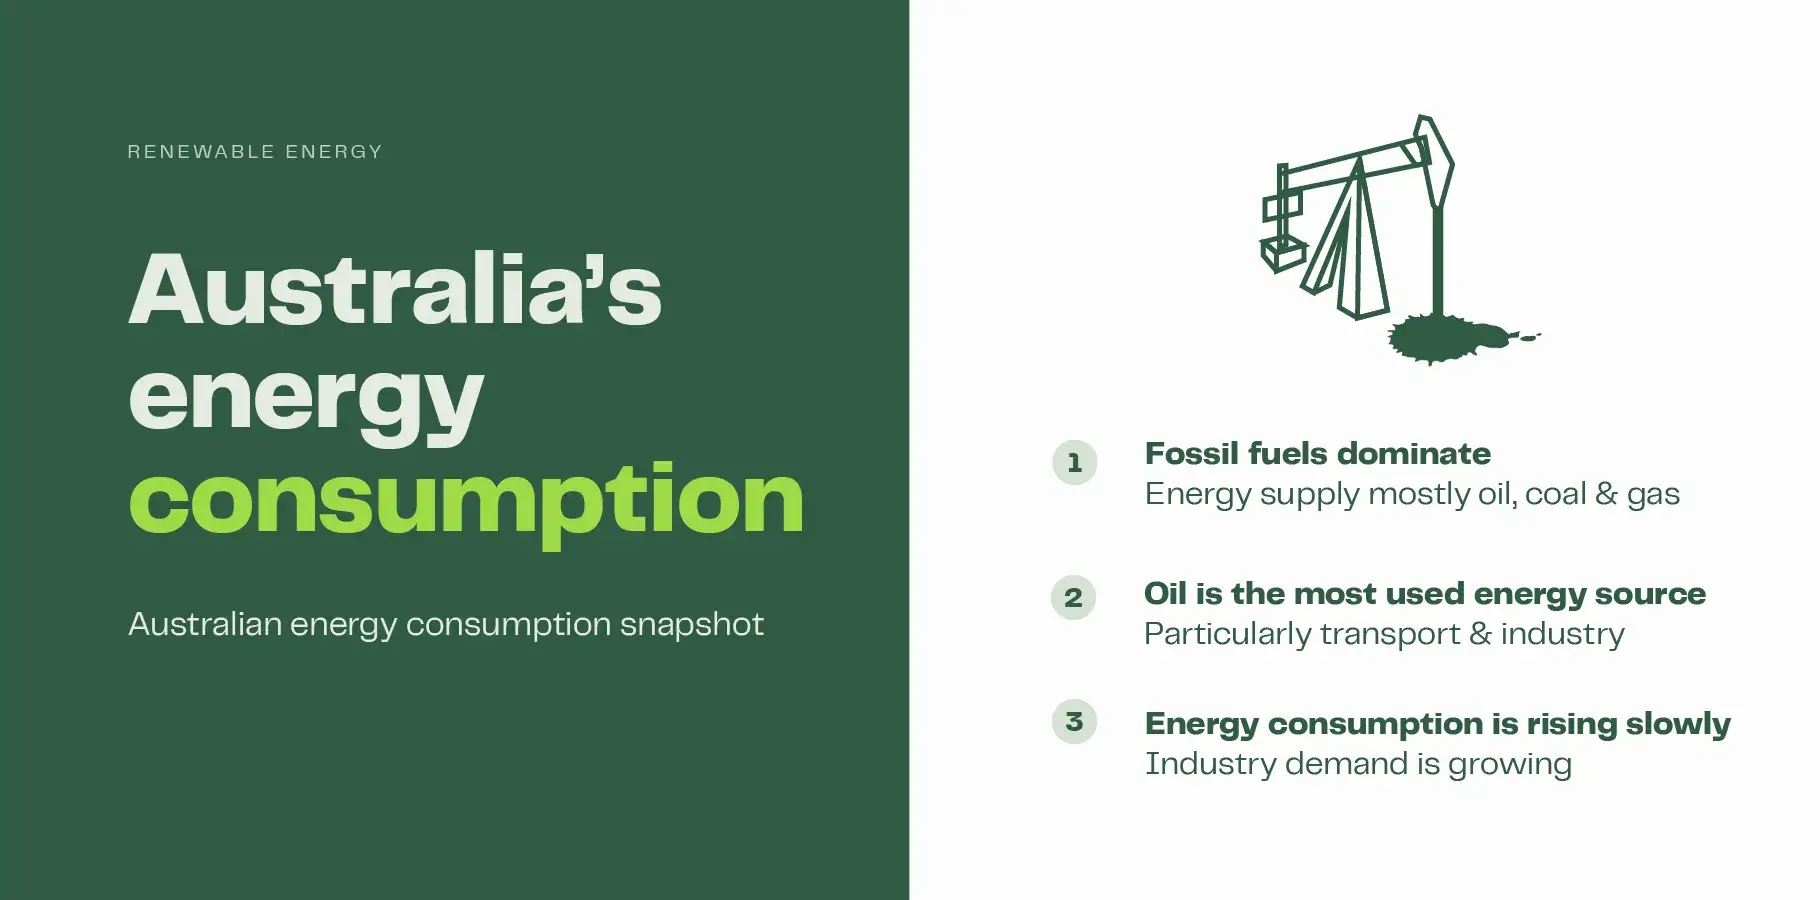
Fossil fuels account for 91% of Australia’s primary energy mix
As of 2023/24, Fossil fuels still account for more than 90% 1 of Australia’s total energy mix with Oil (41%), Coal (25%), and Gas (25%) being the highest contributors to Australia’s fossil fuel consumption.
Oil accounts for 41% of Australia’s total energy consumption
Oil remains Australia’s largest energy source, accounting for 41% 1 of total energy consumption across the country.
Australia’s total energy consumption grew by 0.5% between 2023-24
Australia’s total energy consumption increased by a fairly modest half a percent between 2023 and 2024 from 5,950 petajoules to 5,977 1 petajoules. During the same period, Australia’s population increased by 1.7% 2 which means energy use per person actually declined, reflecting ongoing improvements in energy efficiency and changing consumption patterns.
Transport is the fastest growing energy consumption sector
Between 2023 and 2024, Australia’s transport sector was the fastest growing sector for energy consumption with an increase of 10.6% 3 which continues to climb each year.
Sources:
1 Australian energy consumption | Energy.gov.au
2 Australia’s population grew by 1.7per cent | Australian Bureau of Statistics
3 Energy Account, Australia, 2023-24 financial year | Australian Bureau of Statistics
General energy production statistics

Energy production grew by 1% between 2023-24
Australia’s energy productivity grew by 1% 4 between 2023 and 2024. Australia now generates about $436 million in GDP for every petajoule of energy used – some 24% higher than a decade ago.
Australia exports more than two-thirds of energy that it produces
Between 2023-24, Australia exported more than 2/3 of energy production 4 with some 11,092 PJ of black coal energy (89%), 5,724 PJ of natural gas energy (78%), and a staggering 99% of Uranium (2,725 PJ).
Australia exports 89% of its black coal
Australia holds the world’s fourth largest supply of black coal, and it continues to be exported at a rapid rate with almost 90% 5 of all black coal production exported in 2025. Australia’s main markets for black coal exports include Japan, China, and South Korea.
Australia’s total natural energy stocks fell by 2.4% between 2024-25
Australia’s natural energy stocks declined significantly between 2024 and 2025 with Black Coal (-4.2%) and Natural Gas (-4.4%) declining at the fastest rate.
Sources:
4 Australian energy productivity | Energy.gov.au
5 Coal | Geoscience Australia
Renewable energy statistics

36% of Australia’s electricity generation comes from renewable sources
The latest data shows that more than one-third of Australia’s total electricity generation comes from renewable sources with solar (18%), wind (12%), and hydro (5%) leading the way 6.
Renewables account for 9% of Australia’s total energy consumption
Despite the numerous advantages of renewable energy, it accounts for less than 10% 6 of Australia’s total energy consumption. Whilst renewables are continuing to grow, Australia’s transport and industrial industries still rely heavily on fossil fuels, which keeps renewable consumption relatively low despite strong growth in production.
Renewable electricity generation in Australia grew by 5% between 2023 and 2024
Solar, hydro, and wind generation all increased between 2023 and 2024 contributing to a net increase of 5% during the same period.
2024 was a record year for renewable electricity generation in Australia
Australia’s renewable electricity generation grew by 5% 6 between 2023 and 2024, making 2024 a record year for renewable electricity generation nationwide. Note: at the time of writing, full 2025 generation statistics are not yet available.
Wind farms are Australia’s second largest source of renewable energy
Wind farms contribute around 12% 6 of Australia’s total electricity generation, making them the second-largest renewable source behind solar (18%), and ahead of hydro (5%).
Sources:
6 Renewables | energy.gov.au
Solar energy statistics

39% of Australian homes have solar installed as of 2026
Over 4.2 Million homes 7 now have solar panels installed and are reaping the savings benefits of solar while also reducing their carbon emissions.
Over 247,000 new rooftop solar systems and counting in 2025
There were an estimated 247,784 7 new solar installations across Australia in 2025 with Queensland and New South Wales leading the way on total units installed. Install figures are typically delayed and it is expected they will top 300,000 when final counting is complete.
165,979 solar batteries installed were installed in the first 6 months of being added to the Small-scale Renewable Energy Scheme
Australians have been quick to make the most of solar batteries being added to the Small-scale Renewable Energy Scheme with more than 165,000 7 new installations between July and December 2025.
South Australia has the highest rate of rooftop solar adoption at 54.98%
South Australia is leading the way with the highest percentage of solar installations compared to every other state and territory in Australia. Queensland comes in second place with 52.68%, followed by Western Australia at 48.39%.
Queensland has the highest number of residential solar installations with 1,156,620
Whilst South Australia leads the way on the percentage of total homes, Queensland leads the way with the highest number of residential solar installations with 1,156,620 7 as of Q1 2026, followed by New South Wales with 1,124,155.
Tasmania has the lowest rate of residential solar installations at 24.72%
Given that Tasmania boasts the least amount of sunlight and highest amount of rain of all Australian states and territories, it should come as no surprise that Tassie also has the lowest rate of residential solar installations. The Northern Territory follows closely at 26.04%, while Victoria has the third-lowest uptake at 30.39%.
Sources:
7 Solar Panel Install Statistics and Facts in Australia Solar Calculator
Source link